The City already made this case. Against itself.
Why the King David Mowbray green space matters for heat and flooding, in the City of Cape Town's own words
The strongest argument against concreting this green space is not ours. It is the City's own.
In its climate plan, in its flood policy, in the environmental assessment commissioned for this very project, and in a flagship river-restoration programme it is running right now, the City of Cape Town says plainly that open, vegetated, low-lying land like this cools the city and protects it from floods. Then it proposes to permanently dispose of 42.8 hectares of exactly that. Set the City's words next to the City's plan, and the contradiction is hard to miss.
First, a plain-terms reminder of what a green lung actually does, because the City's own documents take it as given.
A green lung is the city's air conditioner and flood sponge
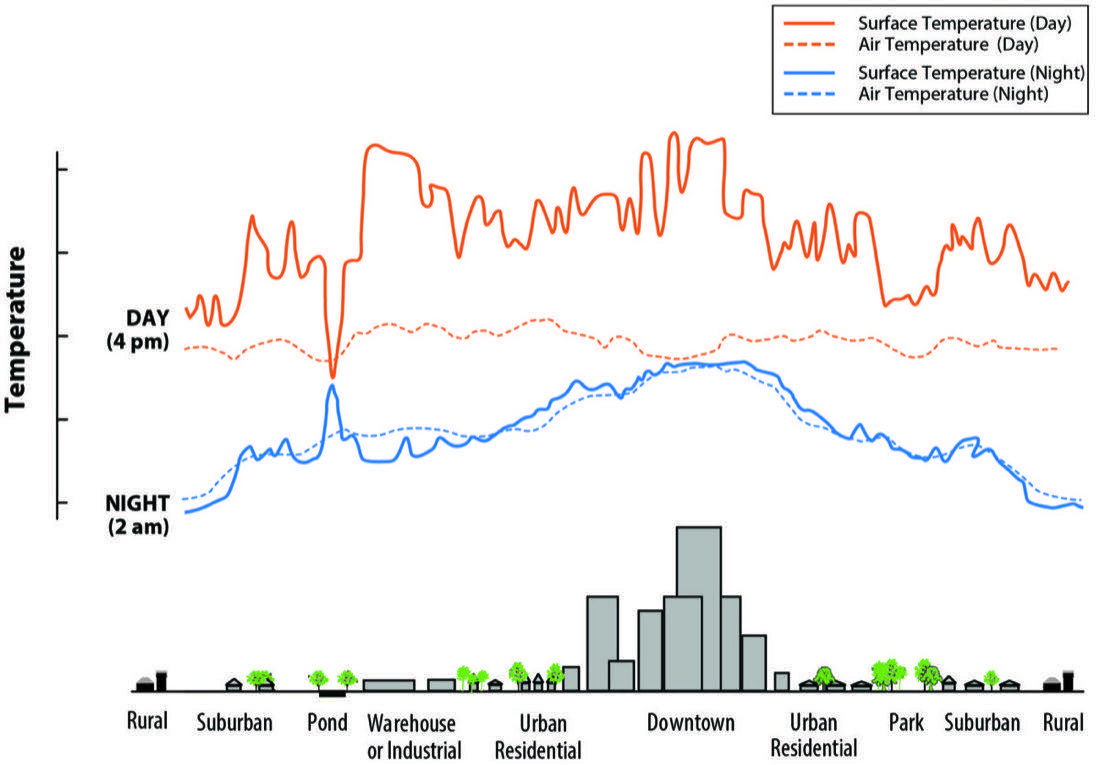
On heat: hard surfaces, tar, concrete, roofs, soak up sunlight all day and radiate it back as heat into the night. That is the "urban heat island" effect, and it is why a built-up area runs hotter than a green one. NASA's thermal mapping has measured city centres as much as 10 degrees hotter than the green land beside them. Green space does the reverse. Leaves shade the ground, and plants release water as vapour, which absorbs heat the way sweat cools your skin. Parks and green spaces measure 1 to 7 degrees cooler than the streets around them, and that cooling drifts outward, often a hundred metres or more past the edge. A green lung of this scale does not just cool itself. It cools the homes and schools around it.
On water: the same open ground is a sponge. Rain soaks into soil, is slowed and stored, recharges groundwater, and is released gently instead of all at once. Cover it in buildings and parking and the rain has nowhere to go but to run off fast and hard onto everyone downstream.
Now hold the City's own statements up against the plan.
What the City says about heat
The City of Cape Town's Climate Change Action Plan warns that heatwaves will increase in length, frequency and intensity. The City's own heat-mapping work has revealed large temperature differences between neighbourhoods, with the hottest areas being the least green. The City knows heat is coming and knows green space is the defence.
It is now proposing to give away one of the largest cooling assets in this part of the city: the very thing its own data says protects the surrounding suburbs from the heat its own plan says is coming.
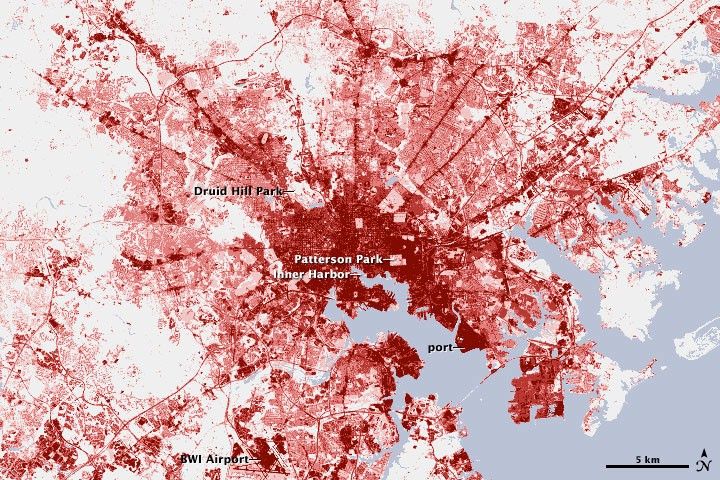
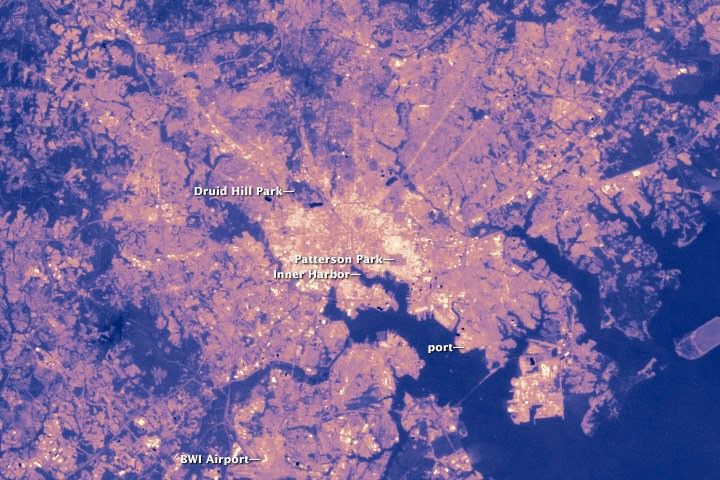
Source: NASA Earth Observatory / Landsat 7, August 2001. Public domain.
What the City says about flooding
This one is the City's own admission, about this exact site. The baseline river and wetland assessment for the redevelopment records that these wetlands "are severely modified but important in providing flood alleviation and stormwater management functions in an otherwise hardened catchment." The City's stormwater policy and Sustainable Urban Drainage principles promote natural drainage, and the City concedes that the land below the 1-in-100-year floodline cannot be built on and must remain open.
The assessment records the function. The consequence is basic hydrology, in our own words, not theirs: hard surfaces do not absorb rain, so covering more of a catchment sends more water, faster, onto everyone downstream. The City accepts in writing that this land absorbs floodwater, then proposes to harden the catchment around it.
To be fair to the concept, it is not "just paving the sponge." The draft proposes decanalising a section of the Elsieskraal, retaining the floodplain wetland, and using Sustainable Urban Drainage systems and stormwater detention ponds (Information Document pp.15 to 16, 23 and 25). The problem is that this mitigation is concept-stage and unquantified, and the Flood Risk Assessment and stormwater study have not been released. Until they are, nobody, including the City, can show that the proposed mitigation offsets hardening the catchment. The public is being asked to support the disposal before that evidence exists.
The contradiction, in one programme
Here is where it stops being interpretation. Right now, the City of Cape Town is working with the C40 Cities Finance Facility on a flagship flood-resilience and river-management programme covering three sub-catchments. One of them is the Elsieskraal. The stated aim is to "improve the conditions of public open spaces and river corridors through the rehabilitation of waterways, wetlands, and floodplains," using nature-based solutions that, in the project's own words, "cool cities, purify the air, tackle biodiversity loss," restore wetlands, recharge groundwater and increase public green space.
In the Elsieskraal catchment, the City is spending international climate finance to restore floodplains, wetlands and green space. In the same catchment, it proposes to permanently dispose of 42.8 hectares of floodplain, wetland and green space. One hand restores. The other develops. They cannot both be the right answer.
The City is contradicting its own climate commitments
The strongest case against paving this site is the City's own. Each item below is the City of Cape Town's stated position, set against what it now proposes.
The City's own climate documents. The City has committed to "carbon neutrality and climate resilience by 2050" (Carbon Neutral 2050 Commitment, 2020; Climate Change Action Plan, 2021), yet proposes to remove a cooling, carbon-storing green space and a flood-attenuating floodplain.
The City lists "conserving our biodiversity" among its climate adaptation priorities, while this site holds wetlands and habitat for the Endangered Western Leopard Toad.
The City commissioned a study on greenhouse-gas mitigation from habitat restoration and afforestation, treating habitat and trees as climate action, while this proposal removes mature canopy (60 to 70-year-old trees) and wetlands.
The City's own Climate Change Hazard, Vulnerability and Risk Assessment names flooding and rising heat as its top climate risks, the two functions this floodplain and green space provide.
Cape Town's C40 memberships (member since 2014). Cape Town is a member of C40's Urban Flooding Network, Cool Cities Network and Water Security Network, and has signed the C40 Urban Planning Accelerator and an Equity Pledge. A city in the global urban-flooding and cool-cities networks is proposing to pave a floodplain and a cooling green space.
Two City policies it showcased internationally, now contradicted. The Coastal Set-back Line (2012), which Cape Town presented to C40 as climate leadership, exists to "ensure that development does not encroach on the immediate coastal environment," based on flood, erosion and biodiversity risk. Its principle is to keep development back from climate-exposed, biodiversity-rich land and protect the natural buffer. A 1:100-year floodplain is that principle applied inland, yet the City proposes to build on and around one its own consultants say provides flood alleviation.
The City's Transit-Oriented Development Strategic Framework makes transport the foundation of land use, with targets of 20% fewer cars and a 23% cut in passenger-kilometres by 2032. This development is marketed as transit-oriented, but its "backbone" station does not exist even on paper: in response to access-to-information requests the City has since sworn, under affidavit, that it holds no feasibility study, business case or agreement for the station, and Prasa has confirmed in writing that there is no commitment to build it. It sits on the barely-functioning Central Line, so it would add up to 36,000 car trips a day, the opposite of the City's own targets.
The contradiction already in the catchment. Through the C40 Cities Finance Facility, the City is spending climate finance to restore floodplains and wetlands in this same Elsieskraal catchment, while proposing to pave one in it.
The City invokes climate change when it suits the budget
It is worth noting how readily the City uses the climate argument when revenue is on the line. During the 2017 to 2018 drought, water use fell so far that the City faced a shortfall of around R1.7 billion in its water budget. It tabled a "drought levy," a charge based on property value rather than water consumption, to recover the lost revenue. After a public backlash it was withdrawn, but tariffs themselves rose steeply through the crisis. Then the drought broke. By 2021 the dams were overflowing. The tariffs did not come back down to pre-drought levels, and when residents asked why, the City pointed to climate change: a water-scarce region, increasingly unpredictable rainfall, and the need to build resilience against future droughts.
Keeping reserves for water security may well be sensible. But notice the pattern. When climate change supports holding a revenue stream high, the City invokes it without hesitation. When climate change argues against a land disposal that would raise revenue, by removing 42.8 hectares of cooling and flood protection, it is absent from the reasoning entirely. The same City that tells ratepayers the climate is too unstable to lower their water bills is willing to remove the green infrastructure that helps the city absorb that instability, because this time the money runs the other way.
It cannot be both. Either the climate risk is real and consistent enough to justify keeping water charges elevated, in which case it is real and consistent enough to weigh against paving a floodplain and a cooling corridor. Or it is not. What the City should not be allowed to do is reach for climate change only when it fills the budget.
And the City protects this habitat too
The City publishes its own material on conserving the Western Leopard Toad, an endangered species endemic to these low-lying Cape Flats wetlands, which has to migrate across open ground to breed. The disposal fragments exactly the corridor the City elsewhere says it is protecting. The Full Story covers the ecological permitting implications in detail.
Cities that learned this too late
The City is not being asked to imagine the consequences. Other cities have run this experiment and paid for it. None set out to flood or bake themselves. Each made reasonable-sounding decisions to build on land that was doing an invisible job.
Houston, USA. With effectively no zoning, Houston paved over the prairie and wetlands that once absorbed its rainfall. When Hurricane Harvey stalled over the city in 2017, the water had nowhere to go and the flooding was catastrophic. Researchers identified decades of unchecked development over absorbent land as a major reason the damage was so severe, and even after Harvey the city kept approving homes in floodplains.
Chennai, India. The closest parallel to what is proposed here. The Pallikaranai marsh, a natural sponge for monsoon rain, shrank from about 2,450 hectares in 1991 to roughly 600 by 2015 as an IT corridor, housing and a rail line were built across it. In the December 2015 floods, the worst-hit neighbourhoods were precisely the former wetlands that had been converted to real estate.
Phoenix, USA. On heat, the cost is measured in lives. Maricopa County recorded 645 heat-related deaths in 2023, up from 425 the year before, and its poorest, least-treed neighbourhoods are the hottest. Where the trees are not, people die.
Jakarta, Indonesia. Decades of unregulated development, paving and groundwater extraction left the city unable to absorb rain and sinking 10 to 20 cm a year, with around 40% now below sea level. The problem became so intractable that Indonesia is spending tens of billions to relocate its capital entirely.
The decision only runs one way
None of this is an argument against housing. The city needs housing, and it can be built in many places. But a cooling, flood-absorbing, air-cleaning corridor of this scale cannot be rebuilt once it is covered. You are weighing homes against the climate infrastructure the surrounding suburbs rely on, at exactly the moment the city is getting hotter and its storms flashier, and against everything the City itself says it stands for.
The City should be held to its own documents.
The comment period closes 7 August 2026. Anyone can object and register as an Interested and Affected Party. One email does it: state who you are, where you live, that you object, and that you want to be registered. Send it to Development.Mowbray@capetown.gov.za and mowbray@infinity.capetown.
Submit your objection, takes 2 minutes
All facts on this page are sourced from publicly available government documents, peer-reviewed literature, and press reporting. Sources are listed below. This site does not represent any political party or organisation.
Sources
- City of Cape Town Climate Change Action Plan (heatwave projections)
- City of Cape Town heat-mapping and thermal inequalities reporting (Daily Maverick, 2024)
- King David Mowbray Golf Course Information Pack; Freshwater Consulting, baseline river and wetland assessment, as summarised in the City/Infinity Draft Development Concept Information Document, May 2026, p.25 (Elsieskraal flood-alleviation and stormwater function); 1-in-100-year floodplain per the same document
- City of Cape Town, Carbon Neutral 2050 Commitment (2020) and "Let's act against climate change" (capetown.gov.za); City of Cape Town Climate Change Action Plan 2021
- City of Cape Town Climate Change Hazard, Vulnerability and Risk Assessment; City biodiversity and climate adaptation priorities documentation
- C40 Cities Cape Town city profile; C40 Cities100, "Set-back Line Protects the Coast and Guides Development"; C40 Cities100, "Transformative Land Use Plan Supports Transit"
- City of Cape Town Coastal Set-back Line (2012); City of Cape Town Transit-Oriented Development Strategic Framework
- City of Cape Town and C40 Cities Finance Facility, "Using nature-based solutions for flood risk management," Elsieskraal sub-catchment programme
- City of Cape Town Western Leopard Toad conservation material
- Cape Town drought levy and water tariff history (The Conversation, 2018; News24, 2021; MIT Technology Review, 2021)
- NASA Earth Observatory urban heat island studies; peer-reviewed reviews of urban green-space cooling (1 to 7 degrees)
- IUCN Red List, Western Leopard Toad (Endangered)
- Houston/Harvey: Kinder Institute, Rice University; Georgetown Environmental Law Review
- Chennai Pallikaranai marsh: Mongabay India; Care Earth Trust
- Phoenix/Maricopa County 2023 heat deaths: Maricopa County Public Health; University of Arizona
- Jakarta subsidence and capital relocation: Al Jazeera; Space4Water